Monitor database resources, response times and availability from one centralized dashboard. Set alert thresholds and receive notifications when issues need your attention, helping your team respond quickly.
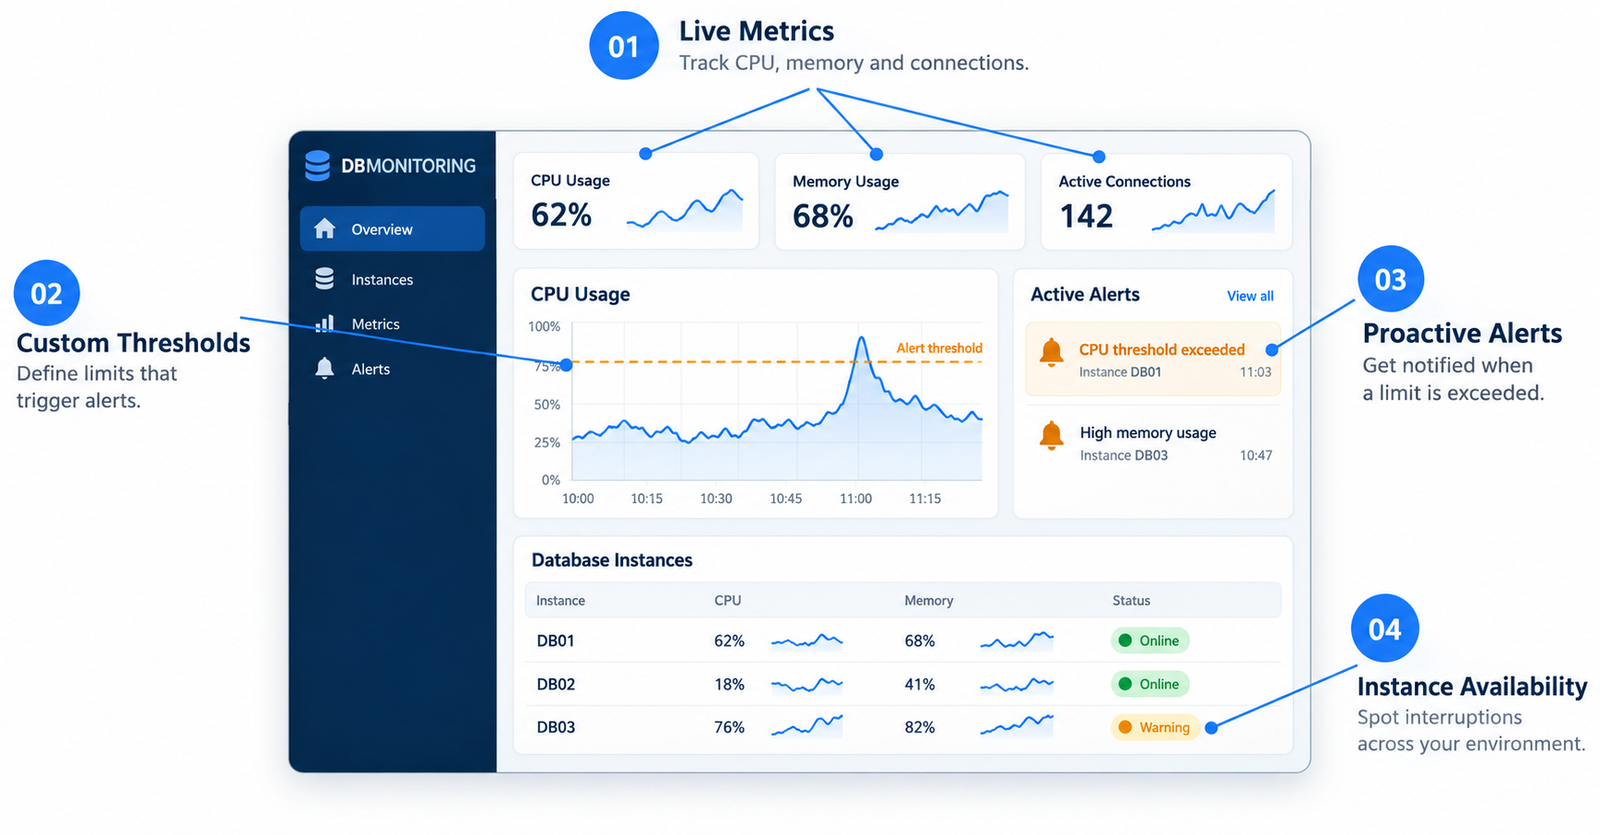
Track CPU usage and memory consumption in real time. Identify resource peaks and act before they affect your database performance.
See when CPU and memory demand increases.
Follow resource consumption over time.
Use clear metrics to guide your next action.
Review database security settings and configurations from one place. Identify unusual changes and monitor essential services to keep your environment reliable.
Keep visibility over access and permissions.
Identify changes that need your attention.
Check service status and investigate interruptions.
View backup status and history from one dashboard. Quickly identify missing or failed backups and keep your team informed about data protection.
See which backups succeeded or need attention.
Track previous backups and their completion times.
Spot missing or failed backups and investigate quickly.

Define thresholds for your key database metrics and receive alerts when unusual activity is detected. Give your team the visibility they need to investigate issues and take action quickly.
Lorem ipsum dolor sit amet, consectetur adipiscing elit. Ut elit tellus, luctus nec ullamcorper mattis, pulvinar dapibus leo.
Identify the affected instance and the metric that triggered the alert to guide your investigation.
Discover how DBMonitoring helps you monitor database performance, detect issues early and respond to alerts from one clear dashboard. Book a personalized demo to explore the platform with our team and see how it fits your environment.
© 2025 DBMonitoring

